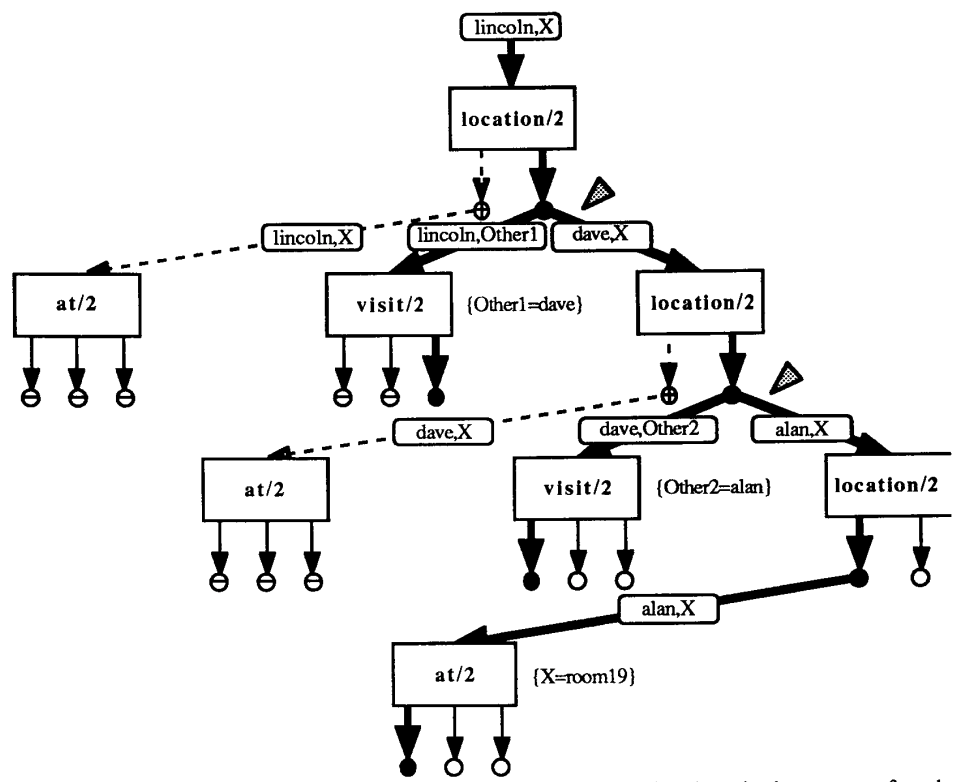
While logic programming has fallen out of fashion, the sizable research program around it in the 1980s and 90s has left us many interesting threads to potentially pick back up. In particular, researchers developed a number of tools to facilitate debugging of Prolog programs. Several systems visualized And–Or trees that represented the execution trace of a Prolog program: the Dewlap debugger 8, the Transparent Prolog Machine 11, and cyclic And–Or graphs 30.
These trees provide some guidance in how to compactly visualize various aspects of a logic program trace, such as unification and backtracking. The Argus system adopts the And–Or structure of the tree but puts a larger emphasis on scaling. Large-scale visualization become illegible quickly and we need to make sure developers can find the information they’re looking for as quick as possible. The idea is that with a quick scan they already have a better idea of what went wrong.
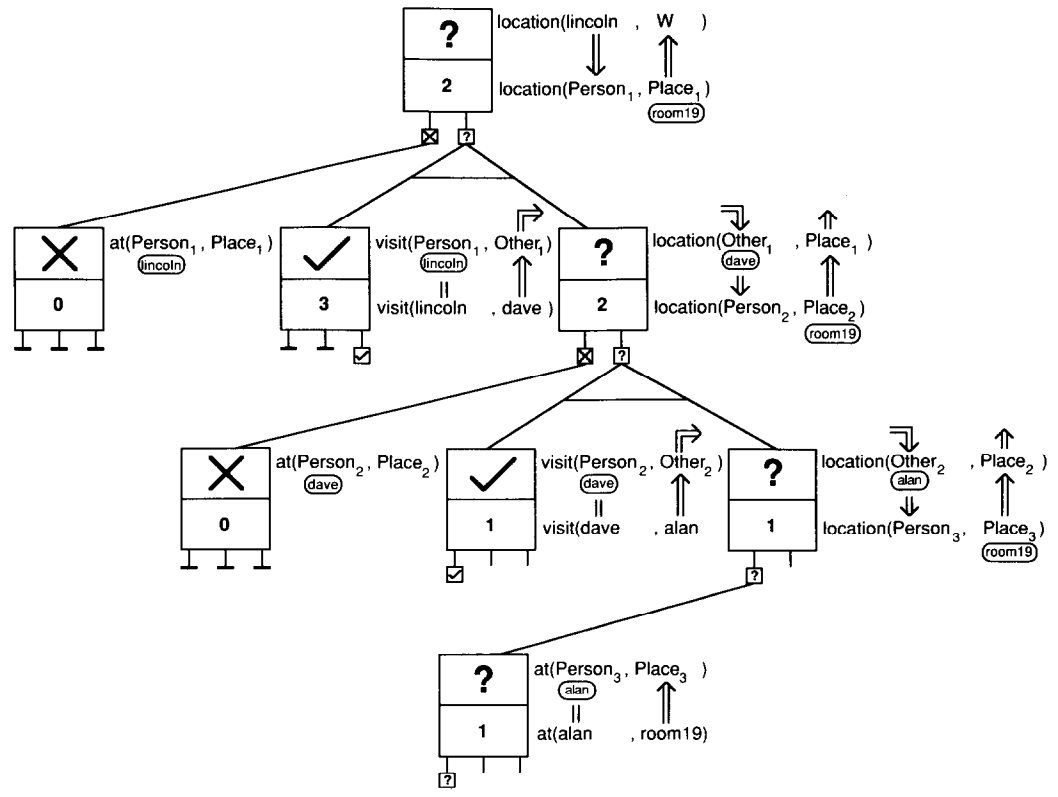
For example, the AORTA diagrams from Eisenstadt include small icons on the nodes and edges that encode control flow direction and unification through the tree. These icons are tremendously helpful in the given example (